Understanding NPV
and IRR
through Excel
Last update June 8, 2023
Net present value
Discount rates
Discounted cash flows
Internal rate of return
Excel files for download
Overview
I have helped people with Microsoft Excel for almost 30 years.
Internal rate of return (IRR) and net present value (NPV) were two subjects that many of my “students” struggled with. Initially, I confess that I, too, had difficulty in understanding the two concepts.
However, laying things out in Excel makes it easier to see how these two important financial concepts work.
Excel
Net present value
When I think about net present value, the first thing I need to remember is that a dollar today is worth more than a dollar tomorrow. This is known as the “time value of money.” Another way to think of that is to think about prices: will a loaf of bread cost more in five years or less? We all know that, on the whole, if you pay a dollar for something today, you will need more than a dollar to buy the same thing five years from now.
Understanding net present value proceeds from that starting point. If you invest $100 today in something, you should receive more than a $100 back, and not just because you want to make money off your investments. So if we imagine putting $100 into an investment—I’ll start calling it a “project”—if we imagine putting $100 into a project, we want to receive more than $100 back from that project.
Let’s take, say, an investment in a friend’s business. Imagine giving her $100 and receiving payments back from her over time. If she pays you $25 a year over five years, you’ve received $125 back, but was that a good decision?
The answer lies in the other options you had for your money.
Discount rates
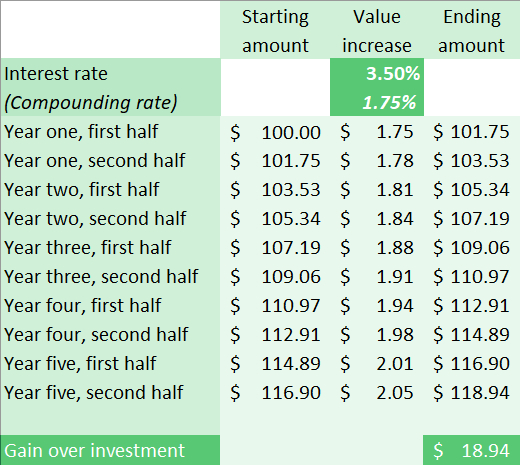
So, let’s now introduce “discount rates.” I think of discount rates as having to do with these other options and what you might earn from those options. For example, instead of giving your friend the $100, you might buy a five-year treasury bond. For the purposes of net present value discussions, we’ll call the interest rate on the treasury bond—say 3.5%—the “discount rate.” You could have a $100 treasury bond that increases in value twice a year, at an annual rate of 3.5% — therefore 1.75% every six months—over the five years.
Now let’s take a look at both of these “projects” in Excel. We’ll start with the Treasury bond. The following table shows how the $100 investment grows over time. It’s important to keep in mind that you are not receiving any payments. At the end of the five years, you can cash in the bond and receive $118.94. Your money has grown in value by $18.94.
Now let’s take a look at your investment in your friend’s business. She has been paying you back $25 a year for five years. You’ve collected a total of $125, so it would appear that you’ve done better than the treasury bond by $6.06.
Discounted cash flows
But that’s not a complete understanding. You’ve received five $25 payments over time. Remembering my comment about the time value of money, we should recognize that the first $25 payment is less valuable than that same amount a year earlier, when the project started. But it’s also worth more than waiting five years to receive the money (the example of the treasury bond). Because we want to know how much our investment is worth in today’s dollars, not five years from now — after all, it’s net present value — we will assess its value at the start of the project.
How much less the $25 is worth depends upon what we use to “discount” its value. For this example, we will use the rate that we applied to the treasury bond, 3.5%. We could use something else, such as, say, an estimation of inflation rate, but that makes our understanding of the treasury bond comparison much more complicated. We’re comparing against the treasury bond—let’s just use that rate.
So, in year one, the present value of the $25 is actually $24.15 using the discount rate from the treasury bond. The present value of the payment our friend makes in year two is actually $23.34. And so on, as shown in column three below.
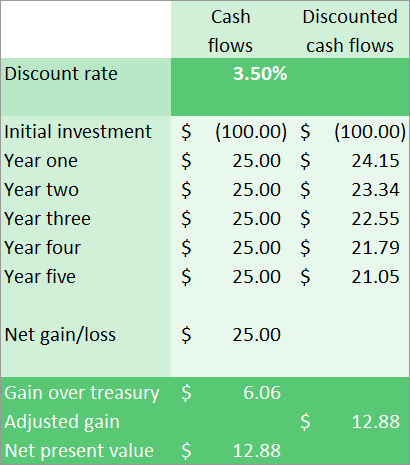
It’s easy for me to imagine that you’re now thinking that the treasury bond returned $18.94 but the loan returned $12.88. I’ll explain this further in a moment, but what the net present value shows us is the comparison between two investment projects. The loan to the friend did $12.88 better than the treasury bond. What we did not show is that using the discount rate of 3.5%, the treasury bond returned nothing! Stated differently, if inflation were 3.5%, the $100 we had at the start is just as valuable as $118.94 after five years.
So the loan to your friend was better not just because it returned a total of $125, but also because the payments received throughout the five years increased the value over the treasury bond example.
A second project
But now let’s add one more scenario. Another friend has asked you to invest in his business. He wants the same $100, but he’s promising a different repayment plan. He will repay you $10 for four years, then $90 in the last year. So he’s promising a total of $130 in payments. Should you do it?
Here’s the layout. Once again, we will use the treasury bond example for our discount rate. (It doesn’t matter too much what rate you use when comparing projects like this, as long as you’re consistent between them.)
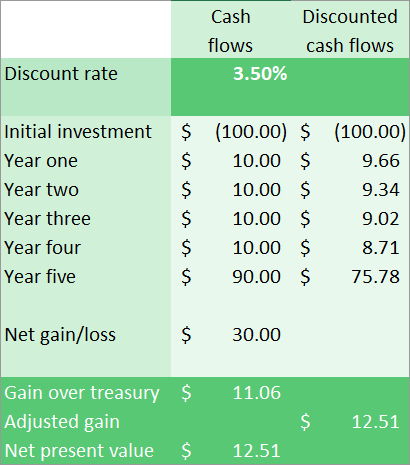
This example shows a net present value of $12.51, meaning that this investment project has a $12.51 advantage over the treasury bond example. However, this project is not as good an investment as the other opportunity, as that investment had a net present value of $12.88. So even though the payments total $130 versus $125, the discounted values of the payments reduce the overall value of the project.
Internal rate of return
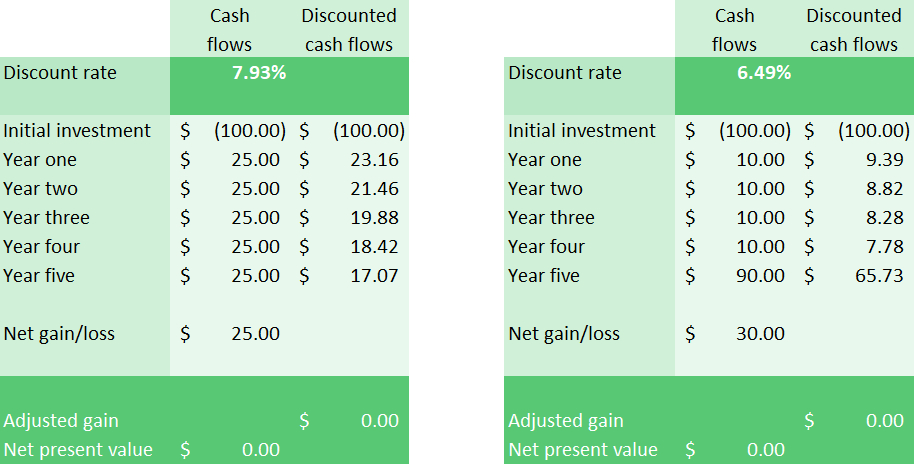
The next thing we should discuss is the internal rate of return (IRR). I think of the internal rate of return as the discount rate at which two projects are identical in value.
This means that we solve the problem iteratively: we have to keep plugging in discount rates until net present value equals zero. And remember, net present value equaling zero simply means that two different investment projects with the same discount rate are of equal value in terms of their present value, the value of our money today.
(Right click and choose “Open Image in New Tab” to enlarge.)
I used Excel’s Goal Seek feature. I indicated that I wanted the adjusted gain (or net present value) to be zero by changing the discount rate. Goal Seek did the rest.
The first project has an internal rate of return of 7.93% and the second project has an internal rate of return of 6.49%.
NPV vs IRR
It is tempting to suggest that the internal rate of return determines the better investment. It is not my intent to show here how that is not always the case. (I have another workbook that attempts to show how IRR doesn’t always indicate the best investment. At some point, I may write up a project to explain why IRR does not determine the better project.)
For now, just remember that net present value is the measurement that truly determines which investment project offers the better return.
Excel files
There are two files of possible interest to my reader.
The first is the workbook I used for this explanation. Click here.
The second is a workbook with several formulas: array formulas, formulas using NPV, IRR, XNPV, and XIRR. It also includes a graphical representation that shows how internal rate of return does not always determine the better investment. Click here.