Pricing model
February 20, 2023
Summary
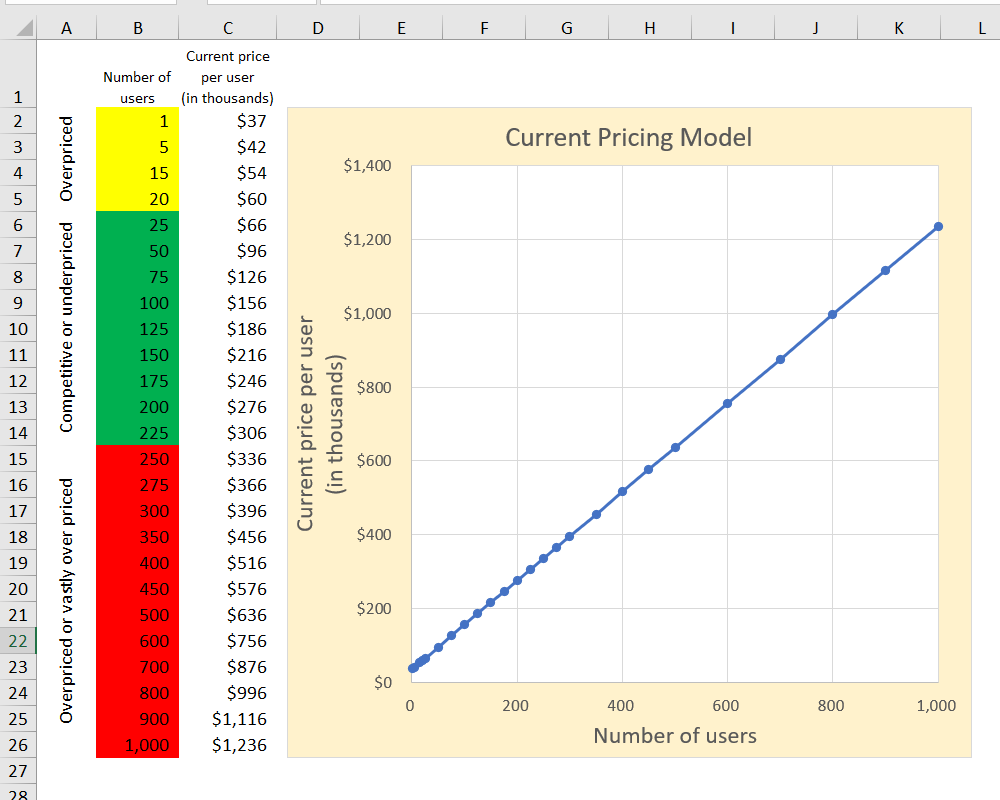
A technology company wished to change its prices. It needed a more flexible and scalable model. Prices were based on a set number of licenses for its products; customers were required to order a particular quantity of licenses, thereby either ordering more licenses than they needed or doing without a certain number of licenses. In addition, competitive analysis suggested that their prices were too high at the upper and lower tiers of the market, and too low in the middle tier.
This project creates a flexible pricing model by basing the pricing algorithm on a polynomial function derived from curve fitting in Microsoft Excel.
Microsoft Excel
Outcome
The project produced a dashboard in which agents could enter the desired number of licenses and have the dashboard provide a price.
Project Steps
STEP ONE: Provide estimates of what the new prices should be.
The first step involved providing estimates of where the company wanted the new prices to be. These estimates were placed on an Excel worksheet and graphed so show a new pricing curve. At this stage, rough estimates are fine. However, later, these numbers need to be tweaked to produce a smooth curve.
After making a first pass at new prices, I refined the estimates to produce as smooth a curve as I could. At one point, I changed the axes to focus on improving my estimates at the lower end of the curve. You can see this at about 0:11.
STEP TWO: Add a trendline to fit the pricing curve.
Once the price estimates were finished, I used the chart to find the best fitting trendline. In this case, the trendline based on a fifth-degree polynomial was the best fit. I use that fifth degree in a LINEST formula, step three.
STEP THREE: Create a LINEST function to get the coefficients of a fifth-degree polynomial.
Using LINEST, I retrieved the coefficients of the polynomial which best fit my pricing guesses. With these coefficients, I can create a formula that provides pricing for all the user counts (licenses) not represented on the worksheet (steps four and five).
(Note: For the LINEST function, you can use SEQUENCE( 1, 5 ) in place of “{1,2,3,4,5}” if you prefer.)
STEP FOUR: Create a formula the calculates prices based on user counts.
With the coefficients returned by LINEST, I was able to calculate any price (“derived y value,” dependent variable) from a given count of users (“known x value,” independent variable). In the video below, I validate the formula by comparing to the price estimates entered above.
STEP FIVE: The last step involves setting up a simple formula that permits input of a count of users (or licenses) and returns the calculated price.
STEP SIX: To finish the project, I created a dashboard to allow a user to enter a count of licenses and other related values and calculate a final price or price adjustment.
Project Files
The Excel Dashboard: There are two versions of the workbook, a macro-enabled version and a macro-free version. The workbook requires a VBA macro that is triggered by changing the drop-down list box. The macro-free version contains the code in a text box on the main worksheet. This was to accommodate anyone concerned about opening a macro-enabled workbook—you can open the macro-free version and configure the macro on your own. It’s actually very simple, basic code.